Data Quest Assignment
Data Quest Report
Produce a report on the enrollment of English Language Learners in Ventura Co. schools.
This assignment entails pulling specific data from the CDE Data Quest system, saving and compiling that data in Excel, and then generating appropriate tables and graphs. Once you have completed your work in Excel, you are going to copy the Excel tables and graph into Word and provide a brief explanation of the data.
Part 1: Pulling EL Learner Enrollment Data
Carry out this same type data query presented in the Data Quest - How To Guide for Ventura County schools for academic years 2008-2009 and 2009-2010. Just follow all steps listed from pages 1-6.
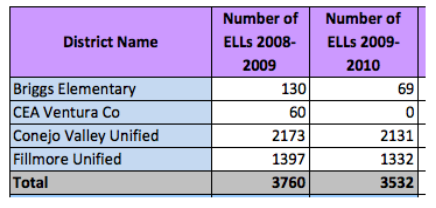
Once you have downloaded and saved your data in two separate Excel files (one containing ELL 2008-2009 data and the other with ELL 2009-2010 data), combine the data into one Excel file and one table.
- Create a new row at the bottom of the Table and generate the Sum of all ELLs for each year. Use the Sum formula.
- •Insert two rows at the top of your data and provide a title and column headers.
- Format your table (color, borders, column width, font, etc.) so that all data is clearly presented and well formatted. See example above (your table will be bigger–more rows and columns).
Part I: Generate a 2-D Column Chart of the 2 Years of Data
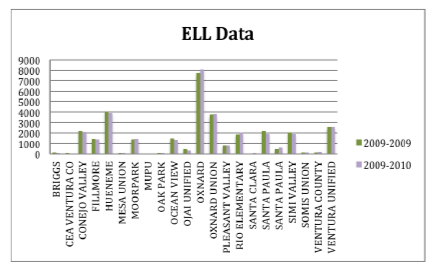
- Insert a Chart Title
- Change your Series information to the appropriate years that the data reflect. See example of the Chart above
Both your two years of EL enrollment data and your graph should now be in this one file on one worksheet called ELL. Make sure all chart and table information is visible.
Save your work. Name file Data_YourName.exls, e.g. mine would be Data_JMcGarvey.xls. You will be using this file for your work and eventually uploading online in Part 5 below.
Part II: Pulling Student Enrollment Data
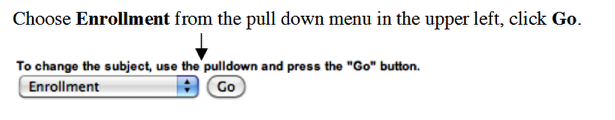
Carry out a new data query so that you obtain total enrollment in Ventura County schools for years 2008-2009 and 2009-2010 (or any two years of your choice). The process is almost identical to the one above in Part 1 except for one thing: Choose Enrollment (not English Learners) before proceeding with the rest of the steps.
Work your way from left to right, top to bottom in the table, selecting the following parameters:
- Choose Ventura in the county area.
- Choose All districts in the Districts area for district data
- Choose All schools from the Schools area for school data.
- Choose the year span, e.g., 2009-2010
- Choose Total Enrollment
- You can leave the next two pull downs at Greater than and 0
- Choose District/School totals only
- Choose a sort order--use Name
Click on the Submit button.
Follow same file saving procedures outlined in the DataQuest–How To Guide. When you are finished pulling your data, you should have two.tmp files. Import them into two separate Excel files and save in Excel format.
Part II: Create a New Worksheet Named Total
Open up the file you saved in Part 1 (Data_YourName.xls). Create a new worksheet and name it Total.
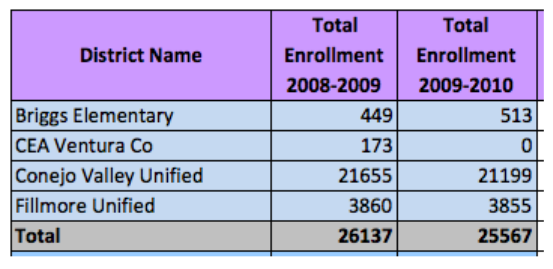
Then combine the data you just downloaded and saved onto this All Student Data worksheet so that your table contains 2 years of student enrollment data. See example above (your table will be bigger - more rows and columns ).
Save your work. Your file now consists of two worksheets: ELL and Total.
Part III: Combining EL Learners Enrollment Data with Student Enrollment
Analyze EL learners growth in Ventura County over two years by comparing number of EL learners (data from Part 1) with student enrollment information (data from Part 2) for the same two years.
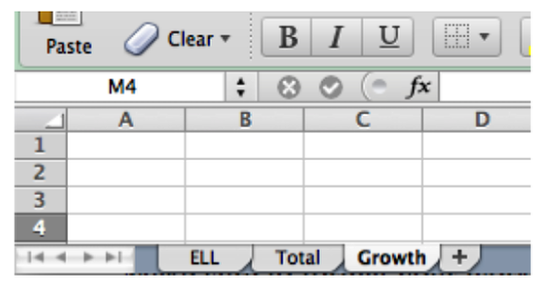
Open your saved file (Data_YourName.xls). Create a 3rd worksheet called Growth.
Copy your ELL and Total worksheet data into to this new Growth worksheet
- Re-arrange and format columns and rows as needed.
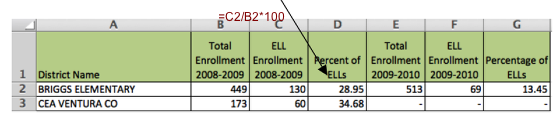
- Insert columns for a percentage calculation (see above)
- Use the formula =C2/B2*100 to generate percentage of ELLs for each year.
- Format cells in Percent of ELLs columns to 2 decimal places.
- Format your table as needed. Give it a title and name the column headers.
- Save your work. Your file (Data_YourName.xls) now has three worksheets: ELL, Total and Growth.
Finishing your Excel Work – Achieving that ‘Polished Look’
Make sure to format all your work properly so that it looks professional. For example,
- Apply cell background color to emphasize information (header & total rows).
- Use bold / italics for emphasis.
- Re-size your table column widths so that columns are not unnecessarily wide.
- Text and numerical information should be right aligned (right justified).
- Look at examples provided for what is expected in terms of style and final look.
The Excel portion of the assignment is complete. You should have one Excel file (Data_YourName.xls) containing three (3) worksheets: ELL, Total, and Growth.
Each of these worksheets should contain all of the information detailed above in Parts 1, 2, and 3. Remove any other worksheets so that your file only contains these three.
Tip 1: It is easier to do all table formatting (cell background color, column widths, row heights, font styles & alignments, etc.) in Excel before copying & pasting into Word.
Tip 2: Format your tables in Excel so that column widths are not any wider then needed. This will make copying and formatting in Word much easier.
Part 4: Generating a Report in Word
You will create a two-page report containing a brief analysis of the data.
- Open Word to compile all the information you’ve generated in Parts 1, 2 and 3.
- In the Header field of your 1st page, type your name in the top left hand side.
- Write a couple of introductory sentences to explain what data is going to be presented.
- Copy and paste your first ELL Table and Chart (from Part 1, Worksheet 1). Position, re-size and format your Table and Chart as needed. There should be adequate space between them and overall, should look professional. Your margins should fit nicely on the page.
- Type a fully developed, complete paragraph explaining the data, referring to data presented in the Table and Chart.
- Copy and paste your Growth Table (from Part 3, Worksheet 3). Position, re-size and format your Table as needed. Fit nicely onto page.
- Type a fully developed, complete paragraph explaining the data, referring to data presented in the Table.
- This work should fit onto two pages. Adjust margin settings to create more space if needed.
- Save your work. Name the file Report_YourName.doc (Report_JMcGarvey.doc).
Part 5: Submit Your Work
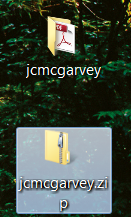
- Create a folder and name it your username. Move your two files (Date_YourName.xls and Report_YourName.doc) into the folder.
- Compress / Zip the folder. To compress on a Mac: Select your folder go under the File Menu and select Compress/Zip. To compress on a PC: Select your folder, right click on the folder, select Sent To ->Compress Folder.
- Upload the compressed /zipped folder, now a file, to Blackboard/Moodle under the assignment: DataQuest.
- If the file is too big you might have to upload it to your Google Docs and share the link by pasting it into the online assignment.